UX KPI / UX KPIs are essential in measuring the success of the UX from a business perspective as well as from a user perspective. Being able to get measured makes the process highly manageable and reliable.
Let’s look at the most important KPIs your business should know about in measuring UX success.
What are UX KPIs?
For UX, different KPIs should be monitored depending on the project. For example, in marketing, conversion rates and the number of quality leads can be good KPIs.
If you are not aware of the term KPI, we got you.
A key performance indicator (KPI) is a measurable way to judge the success rate of a person, process, or organization.
UX KPIs differ from other KPIs because they can interpret human emotions and opinions and convert them to quantifiable data. Measuring, comparing, and tracking such KPIs helps design websites and apps that offer the best user experience.
UX Metrics vs. KPIs
Simply put, UX metrics measure how the user interacts with our products and services. In other words, it assesses the brand’s emotional and cognitive impact on its customers. This can include smart designs, usability, brand recognition, and loyalty.
Regarding the UX design process, these metrics can give you invaluable insight into the user experience. And these data points become useful when making UX design decisions.
KPIs are measurements that help in evaluating the success of the business. These include metrics such as revenue per user, conversion rates, etc.
The key difference between UX metrics and KPIs is that the latter are quantifiable. UX metrics, on the other hand, aren’t easy to measure due to their subjective nature.
But with the right KPIs, we can measure it.
So, when you do UX research, it’s important to choose metrics that match your UX goals and the KPIs of your business.
Why measure UX KPIs?
For starters, it helps to improve the overall user experience.
Changing the interface’s appearance, making it easier to use, etc., may affect the user experience.
But how can we ascertain they were successful?
Without constant tracking of user experience KPIs, it isn’t easy to understand if you’re on the right track and if it’s meaningful and rewarding. The analytics tool can give you a complete picture of what is happening but not why. UX KPIs can help you figure out how you compare to your competitors and where you need to make improvements.
Let’s look at the major reasons for measuring UX KPIs.
- Stakeholder managementHow will you demonstrate the value of UX investments? Communicating your ideas about UX designs with your stakeholders can be a real pain when you don’t have relevant facts and figures on your side to prove your point. The right UX KPIs make it much easier to put forward your ideas, research, and arguments.
- UX benchmarkingKnowing where you stand in the UX journey is necessary to take the right steps forward. Identifying and following the right KPIs helps save time and money. User experience KPIs also help in benchmarking your data against that of your competitors.
- Early warning systemGetting real-time feedback on your UX efforts helps you identify possible issues. UX KPIs give us measurable data on how users perceive and interact with our product. With the right UX KPIs, it’s easy to find important information quickly, which lets you take the steps you need to fix any problems that cause usability issues.
- Track UX progressUX (KPIs) helps us turn vague ideas into trackable metrics. This gives us a good way to see if we are on the right track over time. It gives us insight into the effectiveness of our UX strategy.
Important KPIs to measure user experience
The user experience metrics give us information about the current user interface, which helps us figure out what changes need to be made.
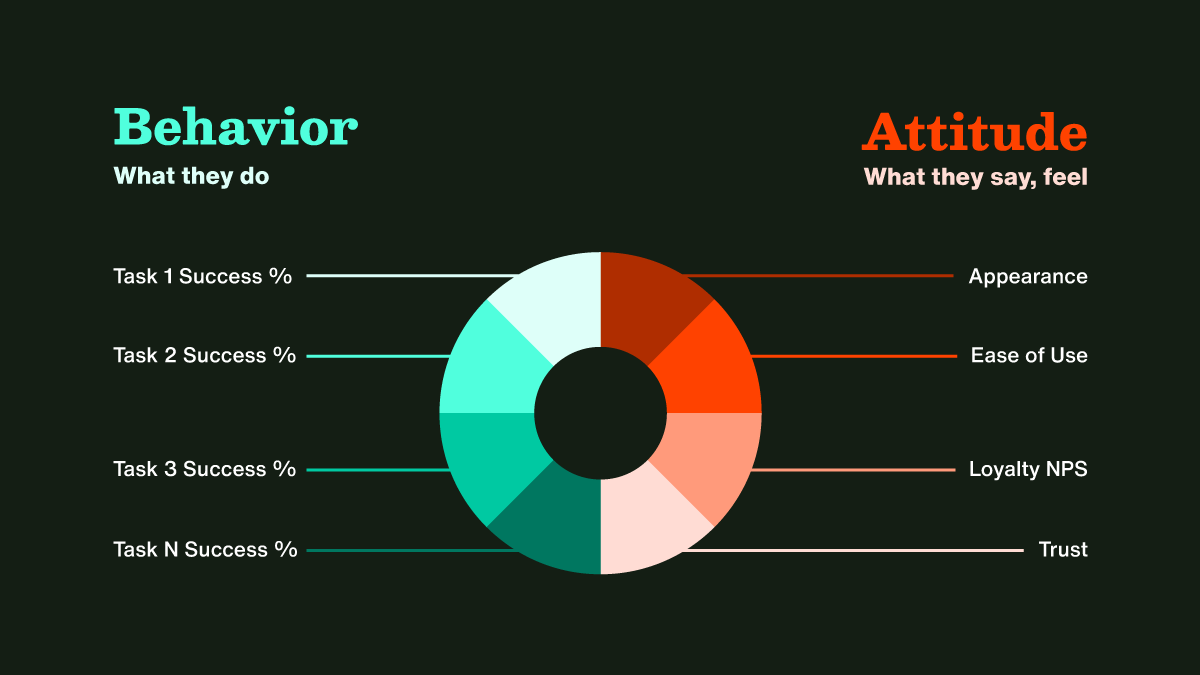
In general, KPIs to measure user experience can be divided into two categories: behavioral and attitudinal KPIs. Behavioral metrics describe how the user interacts with the product, whereas attitude metrics describe what the user thinks about the product.
Eventually, these indicators will help you gain perspective on the overall quality of the UX.
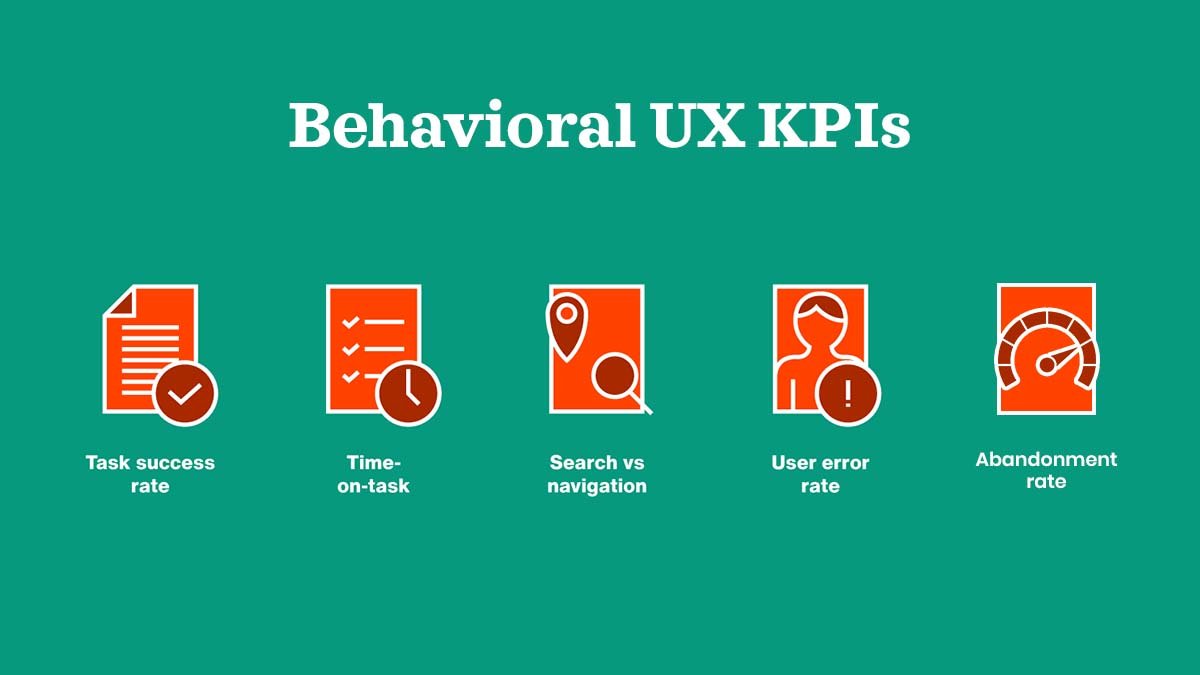
#1 Behavioral UX KPIs
Behavioral user experience KPIs are metrics that help us understand what users are effectively doing and how they are using the product or service. These include:
These include:
- Time-on-task
- Task success rate
- Search vs navigation
- User error rate
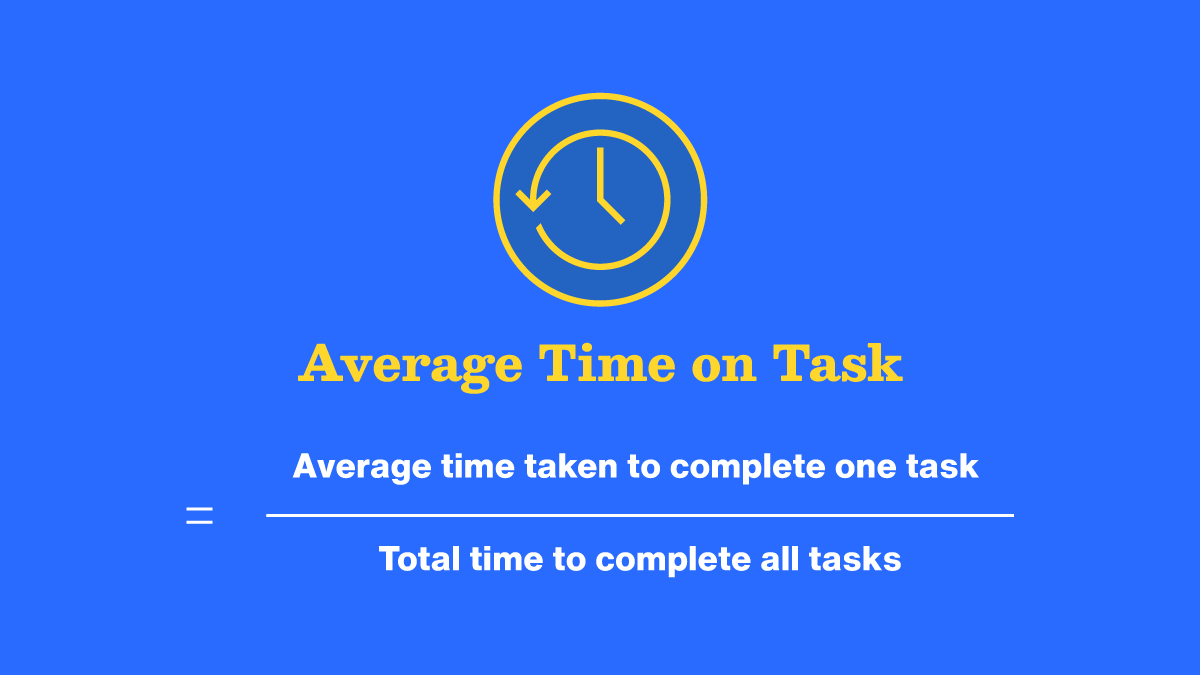
Time-on-task
It is usually an absolute number that tells us the time a user takes to complete a specific task. The lower the average time on task, the better the UX.
However, there are exceptions. For example, if the goal is to make the visitor stay on a page for a long time, like on a blog, then longer task times are considered better.
It can be further refined by dividing this time into two groups: the average rate of completing a task on the first attempt and the average rate on the second or subsequent attempts.
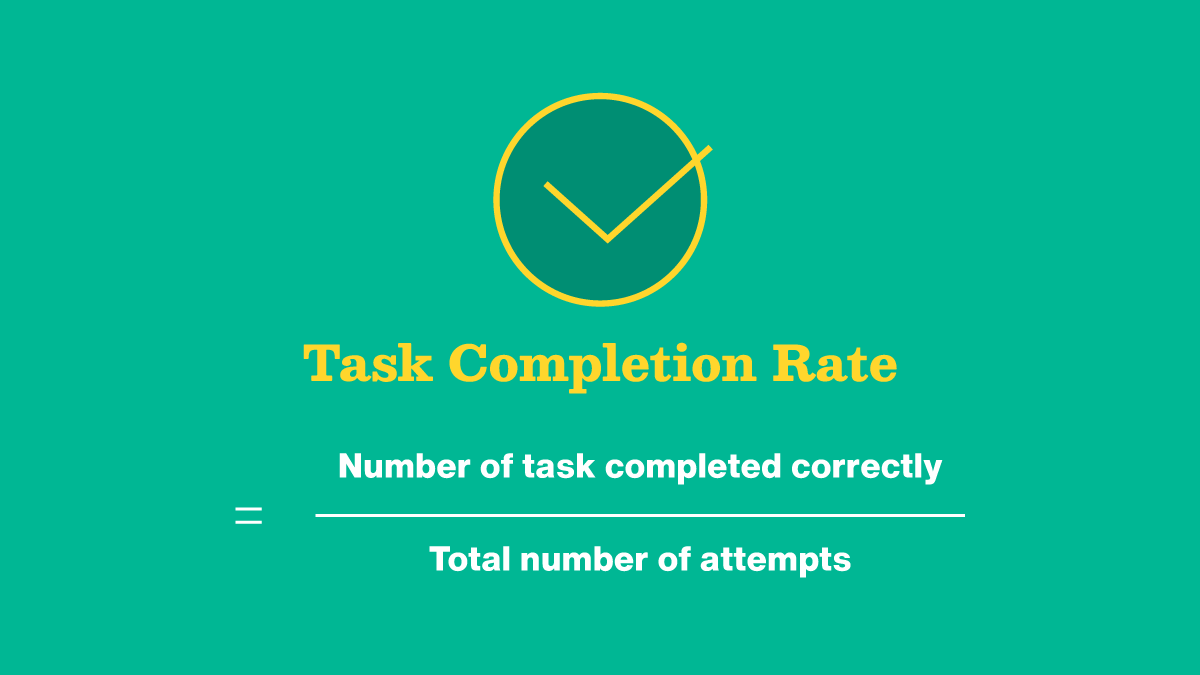
Task Success rate
The task success rate is the percentage of users who complete each step in a user flow. It’s easier to figure out how fast people finish tasks with a clear beginning and an end.
Though this metric won’t allow us to detect a problem, it helps in understanding areas where the users face troubles.
For example, users usually drop off at areas that require more effort or when there is a need for clarification.
Search vs. Navigation
This UX KPI focuses on enhancing the user’s journey through the website. Most of the time, the navigation bar is preferred by users to navigate within the website. If not, the search function is the next step. It indicates that the UX is complex and the navigation isn’t user-friendly.
So, look at these two metrics to see how people navigate your web or mobile app.
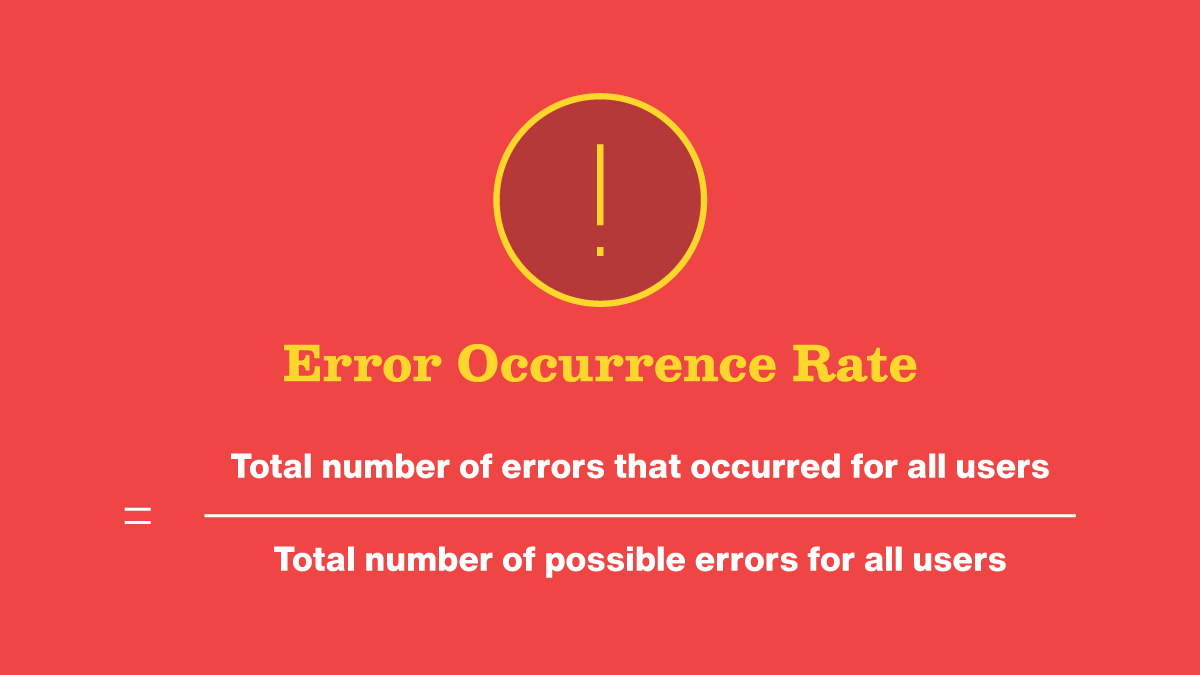
User Error rate
It is a user experience metric that tracks how often users make errors while on your website or apps. It assists you in determining what the user is having difficulty with so that you can create better UX designs and solutions.
For example, if users constantly drop off while filling out a form, chances are that the fields do not make it clear what information is needed.
Abandonment rate
This metric helps determine how many carts were left behind compared to how many processes were started.
There are, however, many reasons why this might happen. For example, a user might have found the same product at a cheaper price, or they might have decided to wait to buy it.
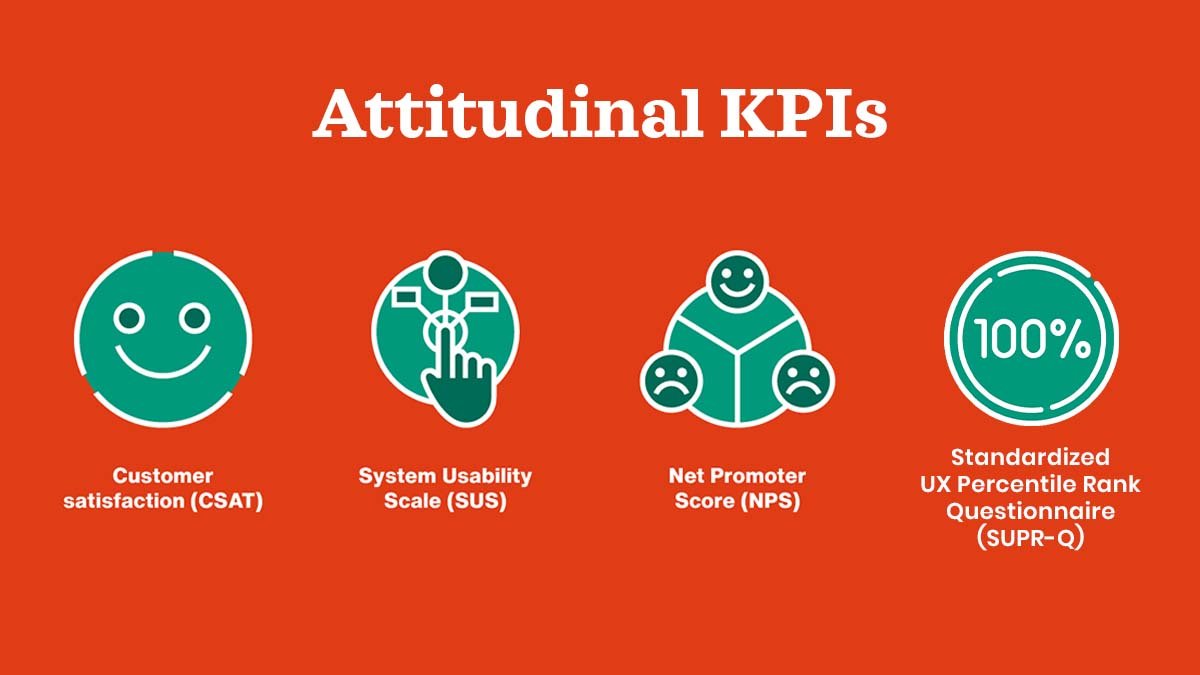
#2 Attitudinal KPIs
Attitudinal UX KPIs help us understand what users feel before and after using a particular product or service and how they perceive it.
They consist of the following:
- Net Promoter Score (NPS)
- Customer satisfaction (CSAT)
- System Usability Scale (SUS)
- SUPR-Q: Standardized User Experience Percentile Rank Questionnaire
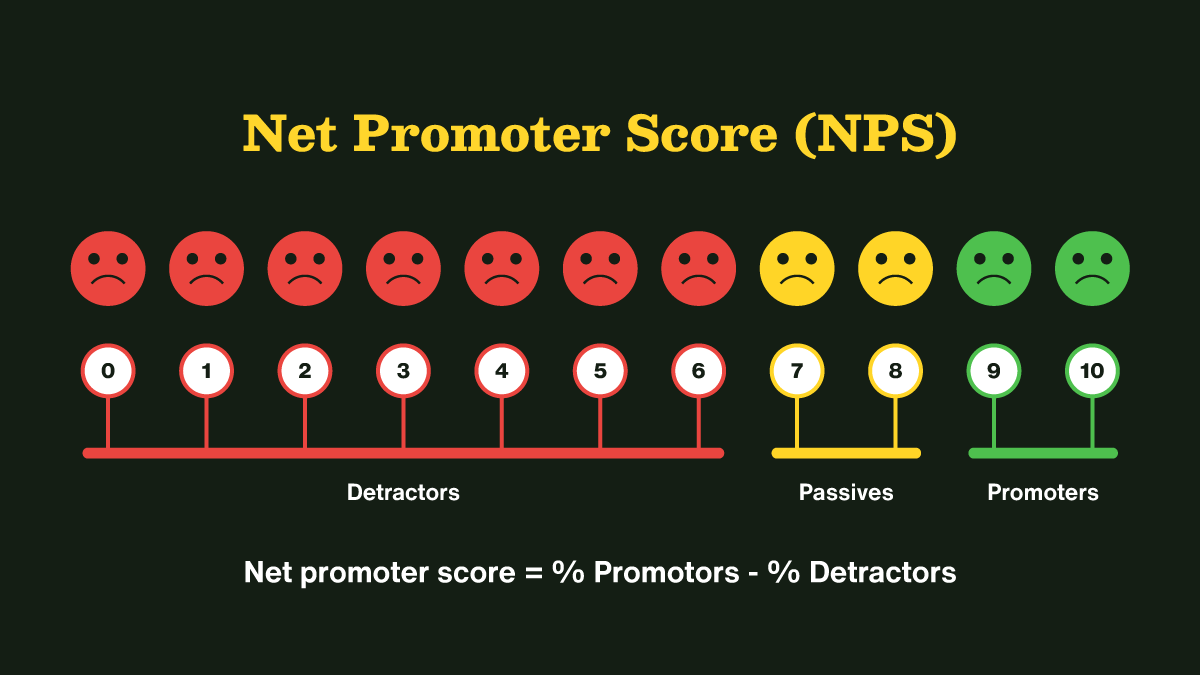
Net Promoter Score (NPS)
It is a measure of customer satisfaction and loyalty that shows how likely a user will tell his friends or coworkers about a product or service. On a scale from 0 to 10, where 0 means “not likely” and 10 means “extremely likely,” the answers are given on a scale from 0 to 10.
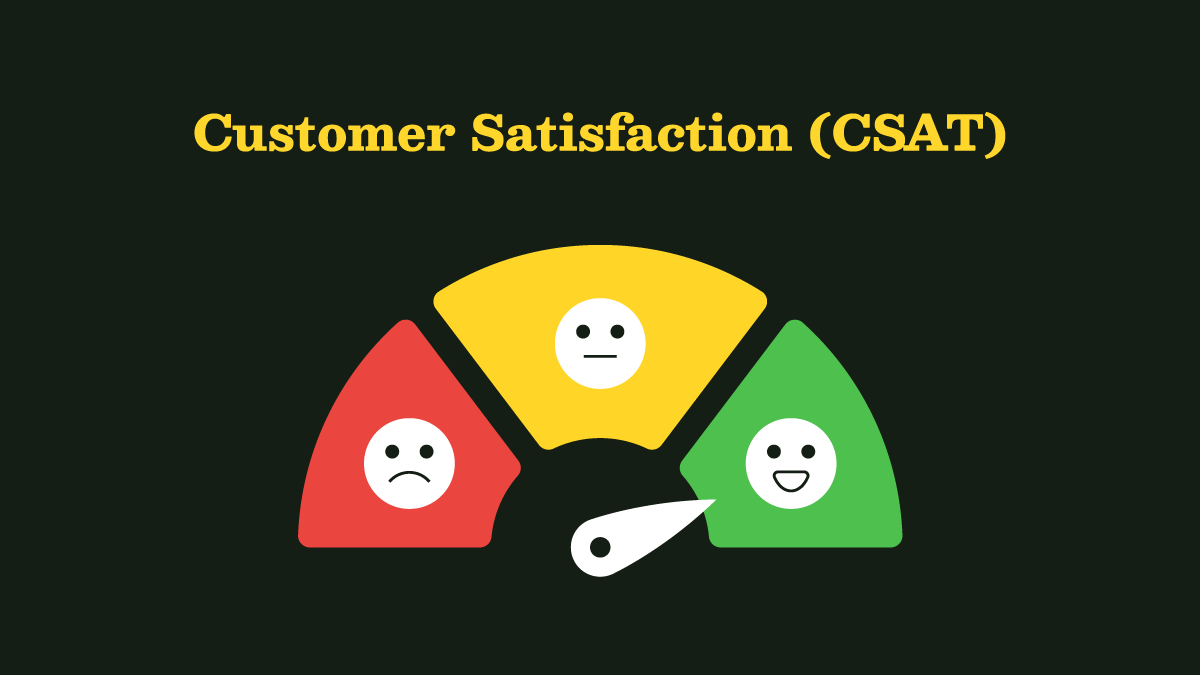
Customer satisfaction (CSAT)
It is similar to the “net promoter score” and measures how satisfied a customer is with a product or service. The survey is provided with five options to indicate the satisfaction quotient. The score is measured out of 100 and displayed in a percentage format.
CSAT could be collected through user interviews, online surveys, or pop-ups. Measuring CSAT at various stages of the user’s journey helps you get a deeper understanding of users’ preferences.
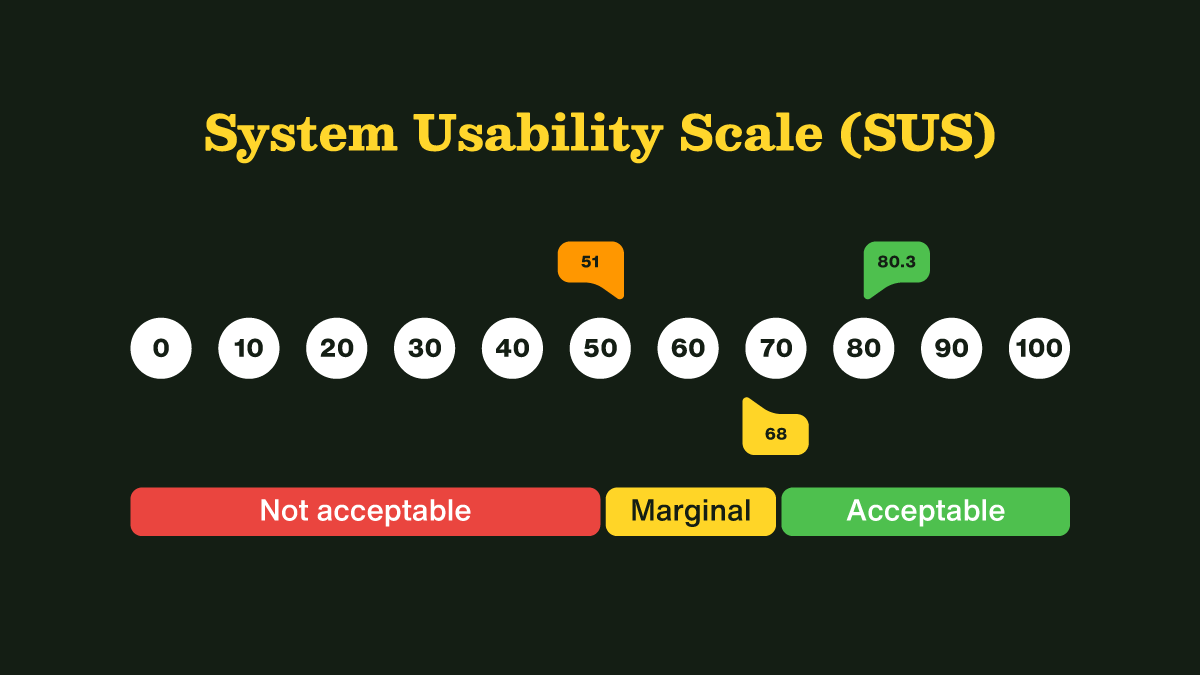
System Usability Scale (SUS)
The system usability scale metric is widely used among UX designers and researchers. They consist of a questionnaire that helps in understanding how useful a product is to the customer and whether it serves its purpose or not. John Brooke first created it in 1986. The questionnaire can be sent online, or the users can be interviewed about it.
SUS is easy to administer and can be used on small sample sizes. However, it does not answer your “why” questions.
SUPR-Q: Standardized User Experience Percentile Rank Questionnaire
In addition to the overall quality metric, the SUPR-Q metric is an 8-item questionnaire that helps measure the quality of the UX by giving information about usability, credibility/trust, loyalty, and appearance.
How to collect attitudinal metrics?
There are many ways to measure how people perceive your product or service, but polls, user interviews, and feedback buttons are the most common methods.
- Feedback ButtonPutting CTAs in the right places on your website and apps is the easiest and most effective way to get the information you need. Users can click on it at any time. It’s important to guide your visitors through their journey using planned CTAs.
- Targeted PollsUnlike CTAs, polls are activated by the website or apps. They are highly focused and help segment your customers based on their responses.
- User InterviewsUser Interviews are the most effective and failsafe method to gather customer data. They provide direct insights into users’ needs and priorities.
KPIs for measuring UX performance
Decisions about UX development cannot be solely based on behavioral and attitudinal metrics. There are a few additional metrics to pay attention to, including:
- Adoption rateThe metric shows the number of new users gained over a specific period. Measuring the adoption rate of a new product helps in understanding the growth of the product among users. For example, if people don’t use a product much, it could be because they don’t know about it or because they don’t find it useful.
- Retention rateThe retention rate measures the percentage of long-term users of a product. Depending on the lifecycle of a product, the retention rate can be measured once a week, once a month, or once a year. It is calculated by comparing the daily active users against the daily new users. It aids in determining which features should be prioritized.
KPIs for optimizing UX
Following the best practices in UX nudges the behavioral and attitudinal KPIs in the right direction. Given below are some of the most important KPIs for optimizing UX.
- Appropriate onboarding flowsA good start defines the rest of your path. A smooth and easy onboarding process complements the rest of the UX journey. The initial process can be made easier by simplifying registration and implementation.
- Intuitive InterfaceUser experience goes beyond customers’ satisfaction while using a product or service. It is also about the value they infer from it. The right user interface and information architecture make the learning experience better and easier for the customers.
- Single Sign-On CapabilitiesUsers can use a single sign-on feature to access multiple tools from a single account. This makes the entire process easier for users with less frustration, less password management, and fewer password reset requests.
- White-Label integrations
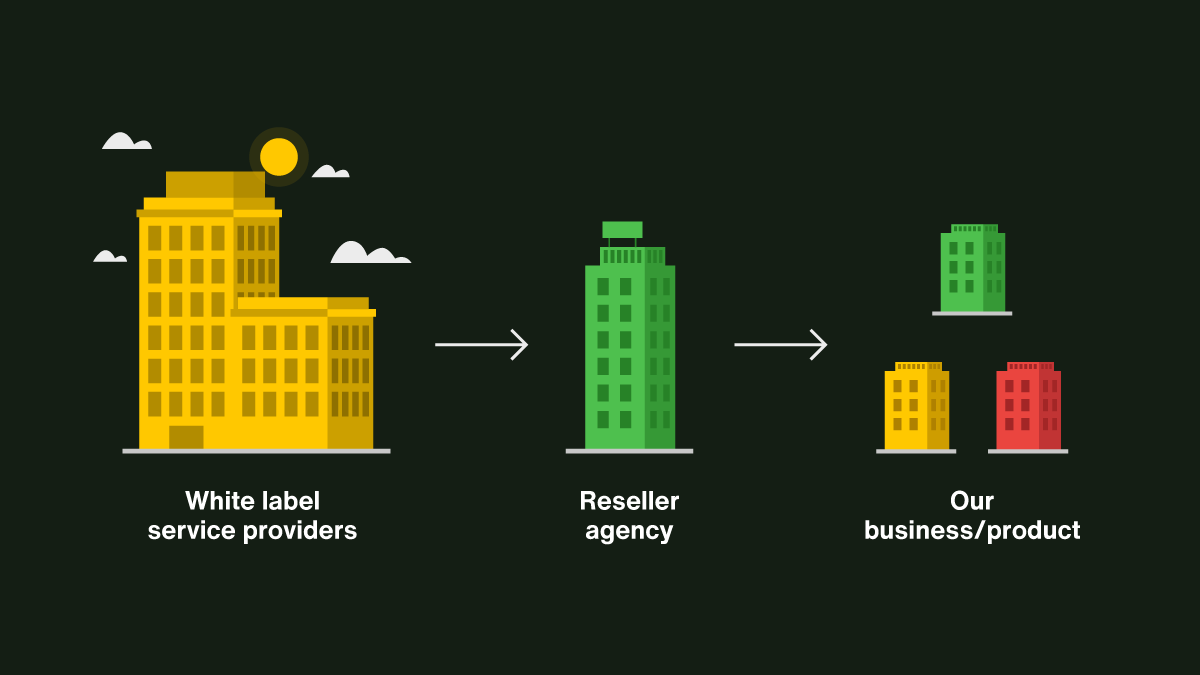
- SourceWhite labeling is a user-friendly alternative to offsite portals and third-party logins. Instead of redirecting users to a third-party page, white labeling provides a unified experience while keeping them within your brand.
- Mobile-friendly designsIt is a must to design products that work seamlessly across different devices and screen sizes. Users tend to have a positive experience if they can access your platform at any time, from anywhere.
- Scalable SystemsDigital products are designed in a way to cope with increasing user demands. Facilitating collaborations and cross-platform synchronization allows multiple users to access shared information. This is more helpful for B2B audiences and remote workers, especially in the pandemic, where almost everyone works from home.
How to select the right UX metric?
Now, choosing which metric to follow can be challenging.
When deciding the metrics, you need to consider what is vital to the customers and your expected UX outcomes. The HEART framework, developed by Google, provides a set of user-focused metrics that assist us in measuring UX satisfaction on a large scale.
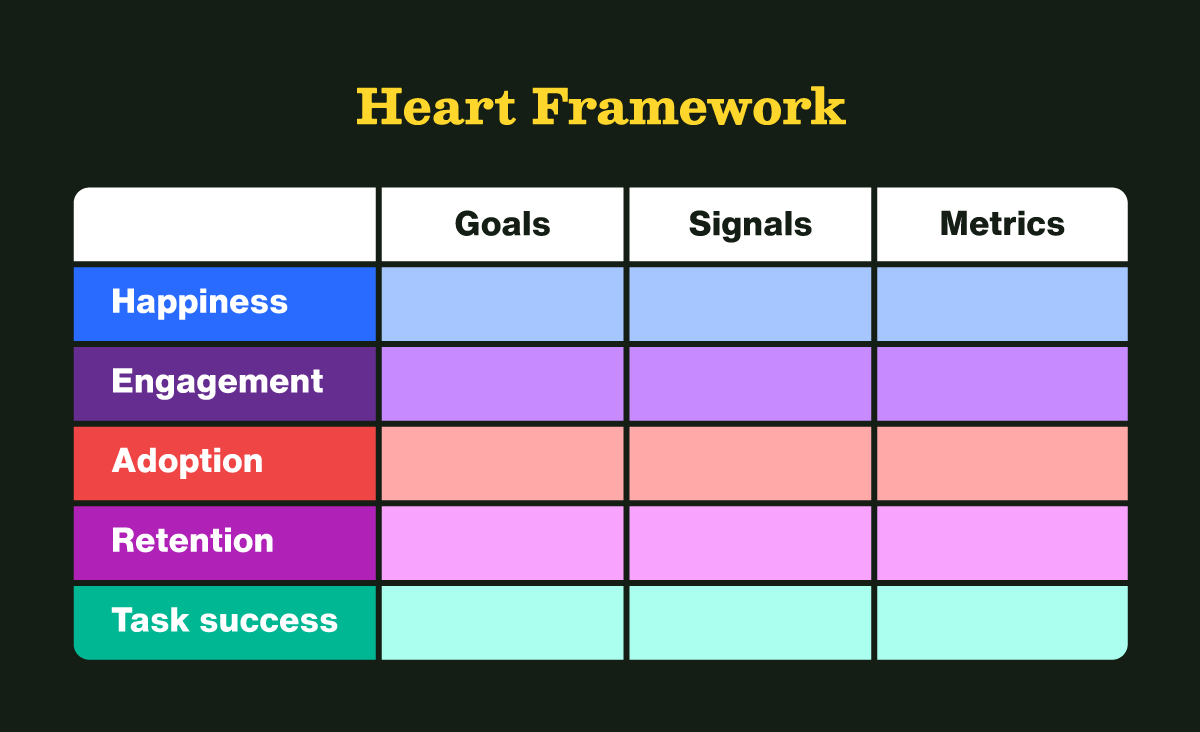
Happiness (H)
It is a measure of the users’ attitude toward or satisfaction with the user interface that is gathered through surveys, polls, and user interviews. It includes the attitudinal metrics NPS, CSAT, and SUS.
Engagement (E)
This measures the overall interaction with the product or service. It looks at how consistent the users are and how often they use it by looking at shares, visits per week, uploads, etc.
Adoption (A)
This UX metric measures how successful you have been at attracting new users over a period of time, i.e., your adoption rate.
Retention (R)
Retention metrics come in handy when you make substantial changes to your interface. It demonstrates how well you kept your current users over time, i.e., your retention rate.
Task success (T)
This metric helps us measure the time spent on an activity or the number of times a specific task is completed once started. Behavioral KPIs such as task success and error rate are included in task success.
How do you incorporate KPIs into a report?
Let’s say you’ve conducted thorough UX research and selected the relevant KPIs. Now it’s time to present your progress in a KPI report. So, here are some tips from the experts:
- For the UX KPI to be effective, you must provide context on why you are measuring it, what efforts must be made to improve it, and how it contributes to the success of the UX.
- To make your UX KPIs visible to stakeholders, it is recommended that you integrate them with the business KPIs.
- Use graphical charts and tools to show important tracking, such as UX progress over time, etc.
Conclusion
In this age, a product that serves customers’ needs alone will fall short.
Don’t pass up the chance to utilize user feedback in real time. The UX should consider the evolving expectations of the market, from appearance to ease of use. With the help of behavioral and attitudinal metrics, keeping an eye on and figuring out the right levels of UX KPIs will help you retain your current customers and attract new ones.
They say it’s better late than never. So, set your goal, choose your UX KPIs diligently, and follow the master plan for UX success.